West Texas Intermediate crude oil prices today is trading around 102.32 USD per barrel on May 13, 2026, positioning the U.S. benchmark at levels not seen since 2022. For domestic operators, fuel buyers, and anyone managing energy costs, understanding what drives these prices—and how oil prices today impact the broader economy, including economic stability and key sectors—has never been more critical.
WTI Crude Oil Prices Today (United States Focus)
As of the morning of May 13, 2026, front-month WTI crude futures are trading near 102.32 USD per barrel, up roughly 0.13% from the prior session and up more than 12% over the last month. WTI crude futures hover around $102.00 per barrel as markets digest ongoing geopolitical tensions and supply concerns, with billions of dollars exchanged daily in oil futures and physical markets.
The focus here is on West Texas Intermediate (WTI) traded on NYMEX/CME, not Brent crude. WTI is the primary U.S. benchmark linked to Cushing, Oklahoma, the delivery point where over 80 million barrels of working storage capacity underpin the market. While Brent crude oil is trading at $110.87 per barrel and serves as the leading global seaborne benchmark, WTI reflects U.S. supply-demand balance and pipeline logistics more directly.
The current price per barrel influences wholesale and rack prices across the country, from the Gulf Coast and Midcontinent to East Coast markets like New York. For businesses managing fuel procurement or investors tracking energy security, WTI provides the most relevant pricing signal.
Current WTI Data Summary (May 13, 2026):
- Date: May 13, 2026
- Current WTI Price: 102.32 USD per barrel
- Daily Change: +0.13%
- 1-Month Change: +12%
- 1-Year Change: +60%+ (from low-60s)
How Today’s WTI Oil Price Is Determined
The WTI oil price per barrel is discovered on futures exchanges through continuous trading, where buyers and sellers react to real-time news about supply, demand, and geopolitics. Oil prices are primarily determined by the forces of supply and demand, with significant influences from geopolitical events and economic conditions. The price of oil updates constantly during trading hours in the futures markets, where contracts for future delivery of oil are bought and sold.
Here’s how the price discovery process works:
- Exchange Trading: In New York (NYMEX), each WTI crude contract represents 1,000 barrels delivered at Cushing, Oklahoma. Trades throughout the day cause prices to change minute-by-minute as market participants respond to new data.
- Supply Factors: Crude oil prices are mainly driven by global oil supply considerations including OPEC+ production quotas, U.S. shale output, and Middle East exports. Total global oil supply shrank by an additional 1.8 million barrels per day in April, tightening available flows.
- Demand Signals: Global demand from the U.S., Europe, and China shapes expectations. Demand for oil is currently showing mixed signals, with estimates suggesting a 4.3 million barrels per day drop in demand in April, though underlying consumption remains resilient.
- Macroeconomic Data: U.S. jobs reports, inflation readings, and Fed interest-rate decisions often trigger sharp intraday oil price moves. When inflation data runs hotter than expected, oil prices have historically spiked 3-5%.
- Geopolitical Shocks: Middle East tensions, sanctions, and disruptions to oil tankers and oil shipments can add risk premiums almost instantly.
- Storage Dynamics: Cushing inventories currently stand at 28.5 million barrels, about 15% below seasonal norms, which has created backwardation in the market where near-term contracts trade higher than deferred ones.
A decrease in oil prices can have significant economic and political impacts, as seen in historical episodes where falling prices affected international relations, domestic stability, inflation, and economic growth in both oil-exporting and importing countries.
Factors such as OPEC’s production decisions, U.S. shale oil production, and global economic growth significantly impact oil price fluctuations.
Recent WTI Trends and Short-Term Outlook
WTI has moved from the low-60s USD per barrel range a year ago to above 100 USD per barrel in May 2026, reflecting tightening inventories and robust demand. This move follows earlier periods when WTI crude oil prices dropped below $62 per barrel, representing one of the most significant sustained rallies since the post-pandemic recovery period.
Over the past month, WTI crude oil prices have risen more than 12%, largely on concerns over Middle East supply risk, steady U.S. refinery runs at 92% capacity, and strong jet fuel and diesel demand. The U.S. Energy Information Administration (EIA) reported that U.S. crude stockpiles fell sharply by 4.3 million barrels, signaling tighter domestic supplies.
Global oil inventories are drawing down at a record pace, dropping by 117 million barrels in April alone according to the International Energy Agency (IEA). The IEA has issued a warning that global oil inventories are shrinking at a record pace due to a cumulative loss in global supply since the conflict began. Changes in global oil production directly impact storage capacity and market dynamics, as increased production can lead to oil gluts and higher storage utilization, while OPEC+ supply increases can trigger sharp oil price plunges, while production cuts can tighten inventories and support prices.
Key factors driving recent trends:
- Weekly EIA reports showing crude draws of 3.2 million barrels last week against expectations of builds
- OPEC+ compliance at approximately 95%, maintaining voluntary cuts of about 2.2 million barrels per day
- Permian rig counts steady at 310 per Baker Hughes, indicating disciplined growth
- Refinery runs absorbing diesel demand up 5% year-over-year from trucking rebound
- Despite record U.S. production in 2025, markets are reacting to changing policies regarding Arctic drilling and gas tax relief debates
Consensus forecasts from analysts at Goldman Sachs and JPMorgan place WTI near the high-90s per barrel by quarter-end and potentially in the 110-115 USD per barrel range over the next 12 months. However, analysts forecast that increased supply could bring Brent down to an average of around $89/barrel by 4Q26 if geopolitical risks subside, which would likely pull WTI lower as well.
In past blog posts on DomesticOperating.com’s oil and gas industry blog, such as the March 2026 piece “Navigating WTI Volatility: Lessons from Permian Drillers,” the company emphasized the importance of monitoring EIA’s Short-Term Energy Outlook (STEO) releases and weekly inventory reports for near-term WTI direction.
Key Drivers Behind Oil Prices Today
Today’s oil prices are the product of multiple overlapping forces, from Middle East geopolitics to U.S. tight oil economics and refinery constraints. Compared to coal, oil production—especially from unconventional sources like oil sands and tight oil—often faces higher breakeven costs, making extraction more economically challenging. Understanding these drivers helps businesses anticipate where prices might head and plan accordingly.
Supply Drivers
- OPEC+ Production Policy: The cartel has extended 1 million barrels per day in cuts into Q3 2026, with Saudi breakevens at 85 USD contrasting with U.S. shale marginal costs of 55-65 USD in the Permian. This pricing dynamic allows American companies to ramp output profitably while OPEC+ manages global oil supplies.
- Unplanned Outages: Libya’s 600,000 barrels per day Sharara restart delays continue adding risk premiums to global markets.
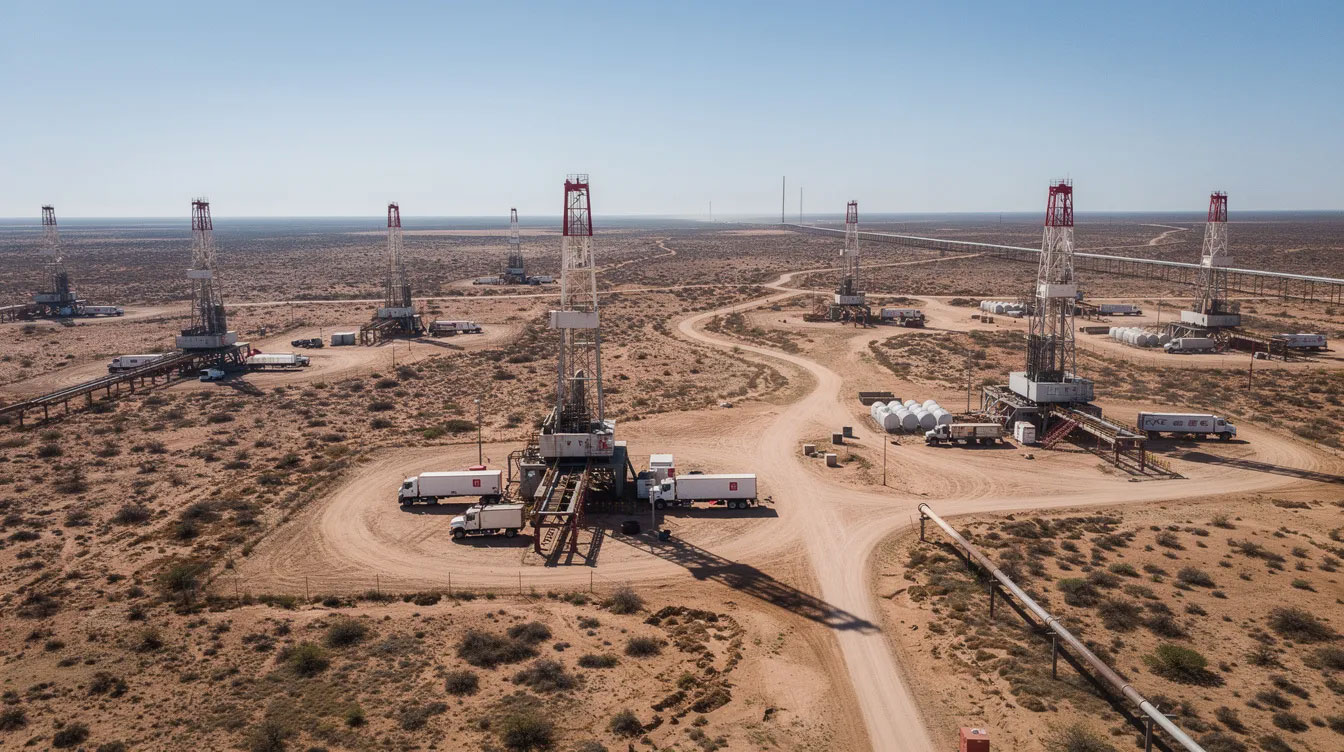
- U.S. Shale and Permian Output: U.S. oil production hit a record 13.5 million barrels per day in early 2026 per EIA, demonstrating the industry’s capacity to respond to higher prices, even after prior episodes when WTI oil prices plunged below $60 and tested energy giants’ resilience.
- Middle East Crisis Concerns: Concerns regarding safe passage through the Strait of Hormuz are causing significant price spikes, echoing recent episodes where WTI crude oil prices surged 3% as global supply tightened, with high prices expected until transit begins to normalize. Prices remain elevated due to the ongoing de facto closure of the strait, which handles roughly 20% of global oil and gas supplies.
Demand Drivers
- Global Economic Growth: Global GDP growth at 3.1% per IMF forecast supports baseline consumption. Economic growth in emerging markets like India continues to underpin oil demand and aligns with OPEC’s long-term crude oil forecast and massive investment gap concerns.
- Transportation Recovery: U.S. jet fuel consumption is up 8% on travel recovery, while summer driving season projections point to gasoline demand peaking at 9.2 million barrels per day in July.
- Industrial Activity: Manufacturing and freight activity in China and Latin America continue influencing global demand patterns.
- Seasonal Factors: The upcoming summer driving season historically lifts U.S. gas prices and crude demand.
Storage and Market Structure
- Cushing Inventories: At 28.5 million barrels, storage is 15% below the 5-year average of 35 million, promoting backwardation where June-July spreads sit at +1.50 USD.
- Contango vs. Backwardation: Current backwardation incentivizes draws from storage rather than builds, supporting near-term prices. In contrast, during contango, traders often buy and store oil with the intention to sell oil later at a profit when future prices are higher, utilizing storage facilities or tankers as part of their trading strategy.
Financial and Geopolitical Factors
- Speculative Positioning: Oil traders have built net long positions of 450,000 contracts per CFTC data, amplifying price swings in both directions.
- Currency Effects: The dollar index drop from 105 to 102 since January correlates with approximately 10 USD in oil gains, as a weaker dollar makes crude cheaper for foreign buyers.
- Interest Rate Expectations: Fed rate cut expectations shift based on inflation data, influencing both the dollar and commodity flows.
- Iran Scenarios: The market is experiencing high volatility as investors analyze potential Iranian war scenarios and their impact on oil prices. President Donald Trump’s warnings on Iran ceasefire fragility and Gulf infrastructure repairs potentially extending to 2027 keep fears elevated.
The energy market is highly volatile due to a mix of major geopolitical conflicts and tightening supplies. DomesticOperating.com interprets these drivers for U.S. operators and fuel buyers, translating global oil signals into actionable domestic insights—as detailed in past blog posts like “OPEC+ vs. Shale: 2026 Battleground.”

WTI Oil Prices, Natural Gas, and U.S. Gas Pump Costs
While oil and natural gas are separate markets, they are linked through power generation, industrial fuel switching, and shared production basins like the Permian. Understanding these connections helps businesses manage broader energy costs effectively.
How crude affects fuel prices:
- Rising WTI crude prices push up wholesale gasoline, diesel, and jet fuel prices. Crude oil often accounts for 55-65% of the final retail gas price per gallon in the U.S., according to EIA crack spread models.
- A 10 USD rise in WTI typically lifts rack gasoline by approximately 25 cents per gallon, though timing and magnitude vary by region.
- Diesel, critical for fleets, tracks tighter with ultra-low sulfur prices currently at 3.45 USD per gallon, while heating oil sits at 3.83 USD per gallon.
The “rockets and feathers” effect:
Gas prices at the pump tend to rise quickly when WTI spikes but fall more slowly when WTI declines. Research from Duke University documented that pumps rise 80% as fast on upticks but lag 40% on downticks due to refiner margin capture and inventory holds. For consumers and businesses managing fuel budgets, this asymmetry means relief from oil prices decline takes longer to materialize at the pump. During periods of oil price volatility, government or industry support can help stabilize fuel prices by providing immediate assistance or strategic backing to the energy sector.
Natural gas connections:
Natural gas (Henry Hub) is currently trading at 2.81 USD per MMBtu. Correlations with oil emerge in Permian co-production, where associated gas flares less at high oil prices, potentially tightening natural gas supplies via reduced exports. While the relationship is imperfect, high oil prices can encourage fuel switching in power generation, petrochemicals, and some industrial processes.
Implications of Current WTI Prices for U.S. Producers and Consumers
WTI above 100 USD per barrel has very different implications depending on where you sit in the energy value chain. Understanding these dynamics helps stakeholders from drilling operations to retail businesses plan appropriately.
U.S. Upstream Producers
- Improved cash flows have boosted internal rates of return from 15% to 45% at 100+ USD WTI in plays like the Permian, Eagle Ford, and Bakken.
- Companies have added approximately 50 rigs since Q1 per Enverus data, though capital discipline and investor expectations are moderating the pace of expansion.
- Approximately 60% of producers have hedged 50% of their 2026 output per Dallas Fed survey data, locking in profits while maintaining upside exposure.
Midstream Considerations
- Higher throughput volumes are straining some infrastructure, with potential pipeline bottlenecks between production regions and Gulf Coast refineries.
- The Matterhorn Express pipeline operates at 750,000 barrels per day capacity versus 1 million barrels per day Permian growth, creating strategic importance for Cushing, Oklahoma storage.
Refinery and Marketing Impacts
- Refiners are enjoying strong margins with 3:2:1 crack spreads widening to 28 USD per barrel from 18 USD, strongest on Gulf Coast PADD 3.
- Regional differences persist between the Gulf Coast, Midwest PADD 2, and East Coast markets including New York and surrounding states.
- Refining capacity utilization at 92% leaves limited room to absorb demand spikes without price increases.
Consumer and Business Impacts
High oil prices tend to increase the cost of producing many products, leading to higher consumer prices and contributing to inflation. When oil prices rise, it can lead to increased costs for transportation and logistics, which in turn raises prices for goods at retail, such as groceries.
- Freight costs have increased 10-15% per ATRI trucking index
- Airfares are up 7% per BLS data
- Supply chain inflation is adding approximately 0.5% to CPI
- Heating oil and diesel expenses are squeezing Northeast businesses and consumers
The International Monetary Fund (IMF) has noted that soaring oil prices can lead to tighter monetary policies by central banks, as inflationary pressures increase. This creates secondary effects on borrowing costs and economic growth for businesses across all sectors.
DomesticOperating.com, based in Dallas, TX and serving the entire country, aims to help U.S. stakeholders interpret these price moves and plan capital, hedging, and procurement decisions accordingly—as outlined in past posts like “Hedging Highs: WTI Strategies for Fleets” and its overview of why invest in domestic oil and gas opportunities.
Historical Perspective: Volatility and Structural Shifts in Global Oil
Today’s WTI level above 100 USD per barrel sits within a long history of dramatic price cycles that have shaped global energy markets and economies. Understanding this history provides context for current conditions.
The Long View
Historically, global crude oil prices were relatively consistent from 1861 until the 1970s, but significant increases occurred during the 1973 and 1979 oil crises, with prices spiking to US$107.27 in 1980. Geopolitical events, such as conflicts and sanctions, can lead to significant fluctuations in oil prices, as seen during the 1973 oil crisis and the 2020 Russia-Saudi Arabia oil price war.
Historical data shows that oil prices have been significantly affected by geopolitical events, including the Iranian Revolution, the Gulf Wars, and the Arab Spring, which have all led to supply disruptions and price spikes. The Persian Gulf region has repeatedly been at the center of these disruptions.
Major Price Episodes
- 1973 OPEC Embargo: Prices spiked to approximately 12 USD (over 100 USD inflation-adjusted), demonstrating oil’s geopolitical weaponization.
- 1990 Gulf War: Prices reached 40 USD amid conflict in Iraq, showing how regional instability affects global markets.
- 2008 Peak and Crash: Oil prices reached an all-time peak of US$147 in July 2008, followed by a significant decline to US$34 in December 2008 during the financial crisis, illustrating the volatility of oil prices influenced by economic conditions.
- 2014-2016 Collapse: The 2013 oil supply glut led to the largest oil price declines in modern history, with a 70% drop in global oil prices from 2014 to 2016, marking one of the three biggest declines since World War II.
- 2020 COVID Crash: Prices fell to 20 USD with a historic negative pricing anomaly at Cushing due to storage overflow, demonstrating what happens when demand collapses and global oil inventories overflow.
- 2022 Russia-Ukraine Impact: The 2022 European Union embargo on Russian oil, in response to the invasion of Ukraine, contributed to a dramatic increase in global oil prices, with Brent crude rising to over $120 a barrel.
Structural Changes
The shale revolution since 2008 added 10 million barrels per day of U.S. supply, fundamentally altering global breakevens and establishing floors around 55-65 USD based on marginal production costs. Meanwhile, oil reserves in the Middle East maintain lower production costs, creating ongoing competition for market share and contributing to cycles like the Dallas Fed–documented slowdown where oil executives warned of an industry-wide pullback.
A drop in oil prices can benefit oil-importing countries by improving their trade balance and reducing inflation, while negatively impacting oil-exporting countries’ economies. Conversely, the rise in oil prices can lead to social unrest in poorer nations due to increased costs of food and fuel, as highlighted by the IMF—a dynamic visible in other countries dependent on energy imports.
In 2026, Middle East risks echo the 1970s, but U.S. shale elasticity now caps ceilings around 120 USD absent a severe recession or major supply disruption. Rising U.S. shale oil breakeven costs projected near $95 per barrel by 2035 could gradually raise those ceilings, representing a structural shift from earlier decades when oil-exporting regions held more unilateral pricing power.

Practical Steps for U.S. Businesses in a High-Price Oil Environment
With WTI around 102 USD per barrel, U.S. fleets, manufacturers, and energy-intensive businesses need concrete strategies to manage cost risk rather than simply react to price spikes. Here are actionable approaches:
Risk Management Options
- WTI Hedging: Consider using WTI and refined product hedges through CME swaps or options. Collars at 95-110 USD strikes offer protection while maintaining upside, particularly in environments where oil prices are falling despite a domestic drilling push, as recommended in DomesticOperating.com’s “Fuel Risk Toolkit” post.
- Term Contracts: Lock in term supply contracts with fuel distributors to reduce exposure to spot market volatility.
- Integrated Procurement: Coordinate procurement decisions with financial risk management teams to align physical and financial positions.
Operational Strategies
- Fuel Efficiency: Implement telematics systems that can cut fleet fuel consumption by up to 12% per DOE case studies.
- Route Optimization: Use software to minimize miles driven and fuel consumed per delivery or service call.
- Equipment Upgrades: Evaluate newer, more fuel-efficient vehicles and machinery where capital budgets allow.
- Modal Shifts: Assess whether rail versus truck makes economic sense for certain shipments given current diesel costs.
Monitoring and Intelligence
- EIA Weekly Reports: Follow Wednesday 10:30 AM ET releases, where surprise draws can lift prices 2-4% almost immediately.
- STEO Forecasts: Review EIA’s Short-Term Energy Outlook monthly for production and inventory projections.
- DomesticOperating.com Commentary: Stay current with ongoing analysis that translates global oil market signals into actionable insights for U.S. businesses.
- OPEC+ Announcements: Track cartel meetings and production decisions that can occur quickly and move markets, even in periods when global oil prices appear steady despite Middle East tensions and supply gluts.
Budget Planning
- Build energy cost scenarios into quarterly and annual budgets using ranges rather than single-point forecasts
- Maintain fuel cost contingency reserves for unexpected spikes
- Review contracts with customers to understand fuel surcharge mechanisms and passthrough timing
Key Takeaways
West Texas Intermediate (WTI) crude oil is trading around 102.32 USD per barrel as of May 13, 2026, slightly higher day-over-day but sharply higher year-over-year. This benchmark remains central for U.S. pricing, influencing everything from gasoline at the pump to diesel for trucking fleets.
- WTI crude prices have climbed more than 60% over the past 12 months, tightening margins for transportation, manufacturing, and energy-intensive industries across the country.
- Supply risks in the Middle East, steady U.S. oil production growth (especially in shale), and resilient global oil demand are the primary forces behind current crude oil prices.
- Global oil inventories are falling at a concerning pace, with the EIA predicting a sharp draw of 8.5 million barrels per day in 2Q26, adding upward pressure on prices.
- Dallas-based DomesticOperating.com focuses on WTI (not Brent crude oil) to help U.S. operators, investors, and fuel buyers understand price impacts on domestic operations, hedging strategies, and gas prices.
- Oil prices today are significantly impacting the global economy, driving inflation and influencing economic growth worldwide as governments, businesses, and consumers adjust to higher energy costs.
- This article covers today’s oil price, short-term WTI forecasts, connections to natural gas and fuel costs, and practical actions U.S. businesses can take now to manage energy costs.
With WTI crude at 102 USD per barrel and global oil dynamics remaining volatile, staying informed and planning proactively isn’t optional—it’s essential for U.S. businesses managing energy costs. Whether you’re an upstream producer benefiting from strong prices, a fleet operator navigating fuel budgets, or a manufacturer watching input costs rise, the fundamentals covered here provide a foundation for better decision-making.
Continue monitoring DomesticOperating.com for ongoing WTI analysis, hedging strategies, and market updates tailored specifically for U.S. operators nationwide.
Frequently Asked Questions (FAQ)
How often does the WTI oil price change during the trading day?
WTI crude trades nearly continuously during U.S. and extended global hours on NYMEX/CME, from 6 PM Sunday to 5 PM Friday ET. Prices can change every second as new bids and offers appear based on breaking news, data releases, or shifting trader sentiment.
After-hours trading and electronic platforms keep markets active beyond traditional New York trading hours, especially when major news breaks overnight in Asia or Europe. Price spikes often occur on Asian news that hits markets while U.S. traders are sleeping.
For readers following “today’s oil price,” understand that any quoted figure is a snapshot that updates constantly while futures markets are open. Real-time quotes from CME Group or financial data providers offer the most current readings.
Why does this article focus on WTI instead of Brent crude?
DomesticOperating.com is based in Dallas, Texas and serves the U.S. market, where WTI is the primary benchmark for physical crude pricing, hedging, and many fuel contracts. Approximately 70% of U.S. crude is priced in relation to WTI.
Brent crude is the leading global seaborne benchmark with about 60% global share, but most U.S. inland and Gulf Coast barrels are priced in relation to WTI, making it more relevant for domestic businesses and consumers. The typical 5-10 USD discount of WTI to Brent reflects inland logistics and pipeline constraints rather than quality differences.
References to global oil trends still matter for understanding market direction, but the price anchor for U.S. operations is WTI, not Brent.
How do current WTI prices affect heating oil and diesel costs in regions like New York?
Heating oil and diesel in New York and the broader Northeast are refined from crude oil and therefore closely track movements in WTI. The passthrough typically runs at about 70%, meaning a significant portion of crude price changes eventually reaches consumers.
Regional factors such as local refinery capacity, seasonal demand spikes in winter, and logistics constraints can amplify or mute the direct impact of WTI price changes. Winter heating oil prices in the Northeast can spike to 4.50 USD per gallon when cold snaps coincide with already-high crude prices.
Residents and businesses in New York should watch both WTI trends and local heating fuel dashboards or state energy data to anticipate winter fuel bills and plan budgets accordingly.
Can U.S. shale oil production bring WTI prices back down?
Higher prices typically encourage more drilling and completion activity in U.S. shale basins like the Permian, which can add supply and eventually ease upward pressure on WTI. EIA projects U.S. production could add 500,000 barrels per day by 2027 at current price levels.
However, capital discipline, investor expectations for returns over growth, and infrastructure limits mean U.S. producers may not rush to flood the market as they did in earlier cycles. The industry has learned from the 2014-2016 collapse when oversupply crushed prices and balance sheets.
Even with strong U.S. growth, global factors such as OPEC+ policy and Middle East risks still heavily influence the ultimate level of crude oil prices. Global recessions or major demand destruction events could also pull prices lower regardless of supply dynamics.
What is the difference between the “spot” price of oil and futures prices I see quoted?
Quoted WTI prices usually refer to the front-month futures contract, which reflects the market’s view of the value of crude for delivery in the near future (typically next month). This is the number most commonly cited in financial news and is what this article references.
The physical “spot” price for immediate delivery is closely linked to the futures benchmark but includes local adjustments for quality, location, and logistics known as differentials. These can range from 0.50-2.00 USD around the Cushing benchmark, incorporating factors like API gravity (39-42 for light sweet crude) and transportation costs.
For most readers, following the front-month WTI futures price provides a reliable indicator of the current price level per barrel and the direction of broader crude oil markets. The data and expected price movements discussed by DomesticOperating.com reference these widely-followed futures benchmarks.