The United States sources most of its oil from two places: domestic fields and Canada. The United States is one of the world’s largest oil producers, with production recently reaching over 13 million barrels per day. While the U.S. has become the world’s largest producer of crude oil, the nation still imports millions of barrels per day to meet demand and match refinery specifications. The economic value of oil to the U.S. is immense, not only supporting domestic industries but also playing a significant role in the world market.
Quick answer: where does U.S. oil come from today?
Most U.S. oil is now produced domestically, but the country still imports substantial volumes because petroleum consumption exceeds what American fields produce. Here’s what the numbers look like:
- Total U.S. crude oil produced reached approximately 12.9 to 13.4 million barrels per day in 2023-2024, making the United States the world’s largest producer since 2018.
- Total petroleum consumption hovers around 20 million barrels per day, creating a persistent supply gap.
- Roughly 60% of the crude processed in US refineries comes from domestic production, with the remaining 40% coming from imports.
- Canada is by far the largest foreign supplier, providing over 60% of crude oil imports approximately 4 to 4.7 million barrels per day via pipelines from Alberta and Western Canada.
- Mexico ranks second at roughly 8-10% of imports, followed by Saudi Arabia at about 7%, then Iraq and Brazil with smaller shares.
- The United States imported petroleum from 86 countries in 2023, but the top five suppliers account for the overwhelming majority.
The United States primarily imports oil from Canada, Mexico, and Saudi Arabia, with North America being the largest regional supplier. The U.S. relies on its North American neighbors for the vast majority of its imported oil, primarily to supply refineries configured for heavy crude. As an example, many U.S. Gulf Coast refineries are specifically designed to process heavy crude from Canada and Mexico, which influences the choice of import sources.
How U.S. oil supply works: crude vs. total petroleum
When you see statistics about “oil,” the data usually combines several related categories. Understanding these distinctions clarifies how much oil the country actually needs to import.
- Crude oil is the raw hydrocarbon liquid extracted from the ground, containing varying mixes of hydrocarbons, sulfur, and other compounds before any refining takes place.
- Refined petroleum products include gasoline, diesel, jet fuel, heating oil, and other fuels created when refineries process crude.
- Natural gas liquids such as propane and butane are often counted separately but fall under the broader petroleum category.
- The difference between crude oil imports and total petroleum imports matters: the U.S. can be a net exporter of total petroleum (exports exceeding imports) while still importing large volumes of crude.
- US refineries are optimized to run specific crude blends categorized as light crude versus heavy crude, and sweet (low sulfur) versus sour (high sulfur) which strongly influences where the nation sources its oil. Many U.S. refineries are specifically designed to process heavy crude oil, while most domestic production consists of light crude oil.
Refinery configurations and sourcing decisions are often driven by the pursuit of profit, leading companies to import certain types of crude oil that maximize efficiency and economic returns. This profit motive influences the types of crude processed and the ongoing reliance on imports despite rising domestic production.
Domestic oil production: how much comes from inside the U.S.?
The United States has held the position of world’s largest crude oil producer since 2018, surpassing Russia and Saudi Arabia. This transformation came largely from advances in shale oil extraction through hydraulic fracturing and horizontal drilling, supported by operators that emphasize experience in oil and gas investments and responsible resource development and highlight why oil and gas can be attractive long-term investments for accredited investors.
- Field production in 2023-2024 reached approximately 12.9 to 13.4 million barrels per day, supplying the majority of crude run through American refineries.
- Texas dominates production, accounting for about 43% of U.S. output, with the Permian Basin spanning West Texas and southeast New Mexico as the primary driver.
- North Dakota’s Bakken Formation contributes roughly 10% of national production, making North Dakota a major oil-producing region in the U.S., while New Mexico adds another 9%.
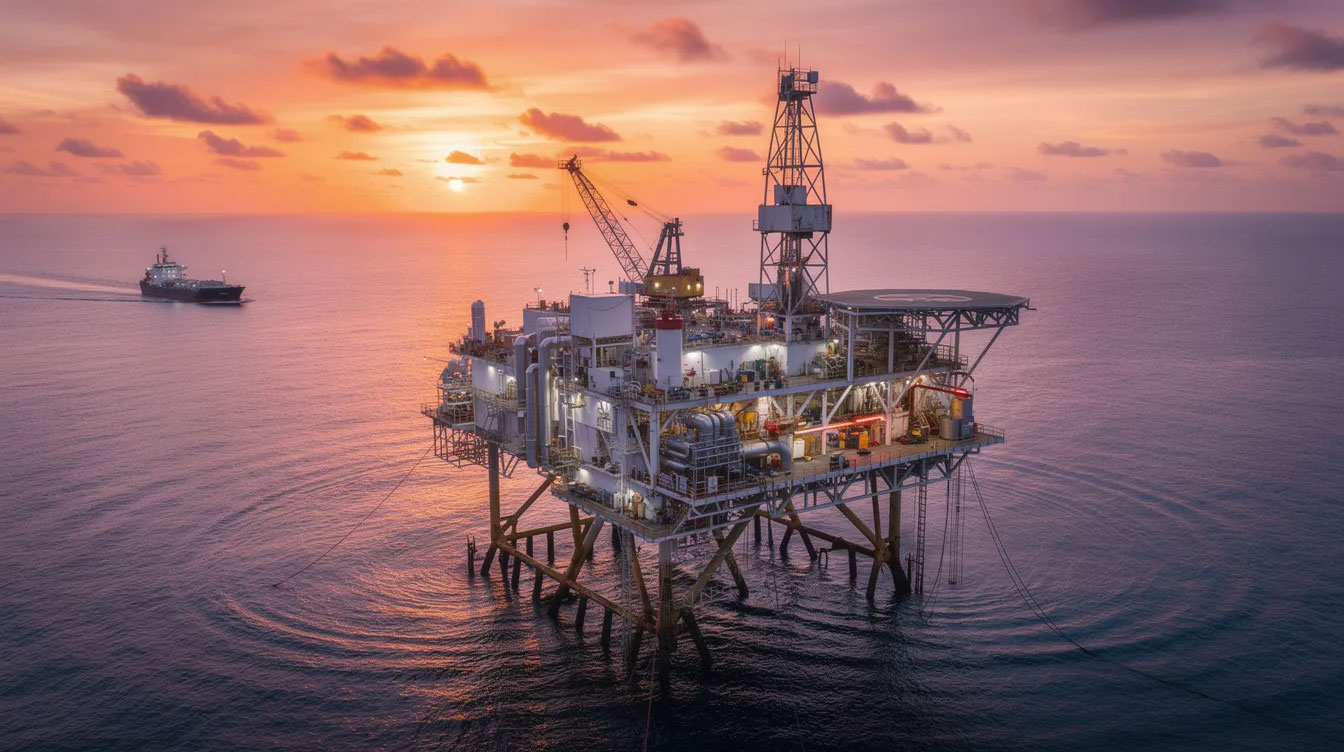
- The federal offshore Gulf of Mexico remains significant, along with smaller contributions from Oklahoma, Colorado, and Alaska, and onshore regions like Texas where firms offer oil and gas investments in Dallas and other producing areas through leading Dallas-based oil and gas investment firms like Domestic Drilling & Operating.
- Directional drilling and hydraulic fracturing in formations like the Permian Basin and Eagle Ford in Texas transformed U.S. output after 2008, boosting production from under 5 million barrels per day to over 13 million, especially as operators adopted advanced horizontal drilling and sustainable infrastructure services.
- Modern production generates associated natural gas, produced water requiring disposal in injection wells, and flaring of excess methane operational and environmental issues linked to the shale boom and reflected in recent trends showing oil and gas rigs still near a three-year low and broader analyses of drilling activity remaining close to multi‑year lows across U.S. basins.
Top foreign suppliers: where U.S. oil imports come from
Although domestic production is at record levels, refineries still rely on oil imports from a concentrated group of countries. Quality requirements, cost efficiencies, and logistics drive these import patterns, which are a frequent focus of oil and gas industry news and investment blogs that also track how global oil prices stay steady despite Middle East tensions and supply gluts.
- In 2023, crude oil imports totaled approximately 6.48 million barrels per day, while total petroleum imports reached 8.51 million barrels per day.
- In 2025, the U.S. imported roughly 7.9 million barrels per day of petroleum and crude oil.
- In 2025, the U.S. exported roughly 10.7 million barrels per day while importing 7.9 million barrels per day.
- Canada dominates as the supplier of most crude oil imports, providing around 60% of crude and 52% of total petroleum imports.
- Mexican imports account for roughly 8-10% of crude volumes, with Gulf Coast refineries receiving heavier grades suited to their equipment.
- Saudi Arabia supplies about 7% of imports, with Iraq, Brazil, and Colombia contributing smaller shares.
- OPEC collectively provides only about 11% of U.S. petroleum imports a dramatic decline from historical levels.
- Persian Gulf countries combined account for roughly 12% of imports, far below their 1970s dominance.
Geopolitical events in the Middle East have historically influenced U.S. oil import patterns and prices, as political upheavals, conflicts, and nationalizations in the region have impacted global oil markets, as do decisions like OPEC+ signaling supply increases that send oil prices plunging.
Data from the Energy Information Administration provides detailed imports by country for readers wanting exact monthly volumes and historical trends, while company reports and galleries showcasing oil and gas projects and facilities offer a more ground-level view of how that supply is developed.
Canada: the cornerstone of U.S. crude imports
Canada isn’t just the largest supplier it’s structurally integrated into U.S. refining infrastructure through decades of pipeline investments and refinery configurations.
- Canada typically supplies more than half of U.S. crude imports, with 2022-2023 data showing about 60% of crude and 52% of total petroleum coming from Canadian sources.
- Alberta’s oil sands represent the primary source, producing heavy crude and bitumen from vast Athabasca deposits using mining and steam-assisted extraction methods.
- Conventional and tight oil from Saskatchewan, British Columbia, and other Western Canadian provinces supplement oil sands volumes.
- The Enbridge Mainline system delivers crude to Midwest refineries, while the Keystone system serves both Midwest and Gulf Coast facilities.
- Gulf Coast refineries specifically upgraded cokers and hydrocrackers to process heavy, sour Canadian crudes—creating demand that would cost billions to redirect elsewhere.
Other key suppliers: Mexico, OPEC countries, and beyond
Beyond Canada, imported petroleum comes from a diversified mix of nearby neighbors and major global exporters.
- Mexico historically ranks among top suppliers, exporting heavier crude grades like Maya (which Gulf refineries are configured to process), though volumes fluctuate with Pemex’s production changes from offshore fields.
- Saudi Arabia’s share has fallen from dominant 1970s levels when OPEC supplied about 70% of total petroleum imports to roughly 7% today.
- Persian Gulf imports collectively represent about 12% of U.S. crude and petroleum volumes, down sharply from historical peaks.
- U.S. sanctions effectively halted imports from Iran entirely and sharply reduced Venezuelan volumes, changing the supplier mix significantly, even as OPEC warns of a massive crude oil investment gap to meet future demand.
- Non-OPEC suppliers in other countries like Brazil (offshore pre-salt fields), Colombia, and emerging producers like Guyana fill niche requirements for specific crude grades at regional refineries.
Why the U.S. imports oil even as a top producer
The United States imports oil not simply because it needs more oil overall, but because of refinery configurations, regional logistics, and pure economics.
- Many Gulf Coast refineries were built in the 1970s-1980s to process heavy, sour crudes from Venezuela and Saudi Arabia, so they still import similar grades primarily from Canada and Mexico even as domestic output is mostly light, sweet shale oil.
- Regional imbalances create situations where East Coast refineries can import seaborne crude more cheaply than transporting oil from inland basins like the Permian, especially before recent pipeline expansions.
- Globally traded crude prices and shipping costs can make imported oil more economical than re-routing domestic production, even when U.S. fields produce at record levels, especially when oil prices are falling despite a domestic drilling push and WTI crude drops below $60 while major energy companies adjust strategies.
- U.S. refineries and pipelines were built over decades based on older supply patterns, so reconfiguring the system for new domestic sources requires significant time and capital investment, particularly as U.S. shale oil breakeven costs are projected to rise sharply.
- Transporting oil from the Permian Basin to East Coast markets by rail can cost $15-20 per barrel, often exceeding the cost of Atlantic imports.
Net exporter status: how the U.S. can export and import at the same time
Being a “net exporter” means exports exceed imports on balance it doesn’t mean imports have disappeared.
- The U.S. became a net exporter of total petroleum (crude plus products) in 2020 for the first time since at least 1949.
- In 2022, exports of approximately 9.5 million barrels per day exceeded imports of around 8.3 million barrels per day.
- The nation still imports substantial volumes of crude oil, refines it domestically, and then exports gasoline, diesel, jet fuel, and propane to global markets where those products command better prices.
- Most U.S. petroleum exports are refined products and hydrocarbon gas liquids like propane, which have surged since the shale boom began around 2008.
- This two-way trade reflects the U.S. role as a major refining hub, especially along the Gulf Coast, where facilities process both domestic and imported crude for export markets.
How U.S. oil moves: transport, storage, and markets
Oil supply involves more than production statistics it requires understanding how barrels move through pipelines, ships, rail, and storage terminals before reaching consumers.
- Pipelines carry most crude and refined products within the country; by the mid-2010s, well over half of crude reaching refineries arrived via pipeline infrastructure.
- Tanker ship transport and barges move imported oil to coastal refineries and carry domestic crude and products along coastlines and inland waterways.
- Crude-by-rail grew sharply after 2005 from regions like North Dakota’s Bakken, especially to East Coast refineries where pipeline access was limited, then moderated as new pipelines came online.
- Above-ground storage terminals and the strategic importance of the U.S. Gulf Coast as both import and export hub anchor the entire distribution system.
- The Cushing, Oklahoma storage complex and the Strategic Petroleum Reserve (roughly 700 million barrel capacity) provide market buffers.

From refinery to driver: products distribution and branding
Once crude is refined, fuels move through a separate distribution network before arriving at service stations and other end-users.
- Refined products like gasoline and diesel travel from refineries to bulk terminal facilities by pipeline, barge, or rail, then get delivered by tanker truck to retail locations.
- Gasoline from different refineries and even different import sources can be mixed in common carrier pipelines, where brand-name additives are blended in at distribution terminals.
- Many U.S. service stations are independently owned or franchised, so the logo on the canopy doesn’t necessarily indicate the original source country of the crude used to make the fuel.
- Public data can show which oil companies import crude or gasoline into the U.S., but cannot reliably trace which specific barrels ended up at any local station’s tanks.
- Refining transforms imported crude into other petroleum products that may ultimately serve domestic or export markets.
Historical shifts: from heavy reliance on OPEC to North American dominance
U.S. oil sourcing has transformed dramatically since the 1970s, with past crises shaping current diversification strategies and the industry’s structure.
- In 1977, OPEC countries supplied approximately 70% of total petroleum imports and 85% of crude imports, leaving the U.S. vulnerable during embargoes that spiked prices to inflation-adjusted equivalents of $150+ per barrel.
- North Sea production, Alaskan output from Prudhoe Bay (which peaked around 2 million barrels per day in the 1980s), and expanding Canadian supplies gradually reduced OPEC’s relative share.
- The “shale revolution” beginning in the late 2000s saw rapid growth from the Bakken, Eagle Ford, and Permian basins, with techniques pioneered by Mitchell Energy transforming previously uneconomic formations.
- The decade following 2005 marked peak U.S. petroleum imports at 10.5 million barrels per day; growing domestic production and rising exports since then cut net import dependence by roughly 75% by 2020.
- Canada’s share climbed from about 10% in the 1990s to over 52% by 2022, cementing North America as the U.S.’s primary supply region for more oil than any other global source.
Changing shares: OPEC, Persian Gulf, and Canada over time
The composition of U.S. imports tells a story of strategic diversification away from distant suppliers toward North American partners.
- In 1977, OPEC supplied about 70% of U.S. total petroleum imports; by 2022, that share had dropped to approximately 11%.
- Persian Gulf countries (a subset of OPEC) supplied about 12% of imports in 2022, with Saudi Arabia alone at roughly 7% a fraction of historical levels.
- Canada’s share of U.S. total petroleum imports rose dramatically from the 1990s onward, reaching about 52% of petroleum and 60% of crude imports by 2022.
- This shift reflects both increased Canadian production from oil sands and tight oil plays, plus declining U.S. interest in relying on more distant and politically volatile suppliers.
- An interactive chart tracking these data ranges over several decades would visually demonstrate how fundamentally U.S. sourcing has changed.
Environmental and justice dimensions of where U.S. oil comes from
The geographic sources of U.S. oil both domestic and foreign carry environmental and social consequences for communities hosting extraction and infrastructure. For example, major U.S. oil fields including parts of the Permian Basin and Bakken overlap with Native lands or affect nearby Indigenous and rural communities, raising concerns about air quality, water use, and land disruption. Communities near oil extraction sites, particularly minority and Indigenous populations, often face health risks such as higher rates of asthma and cancer due to environmental pollution from oil operations.
Gas flaring and venting of associated natural gas especially in shale plays contribute to greenhouse gas emissions and local air pollution, with Permian flaring reaching approximately 1.5 billion cubic feet per day in 2023. Produced water management from shale and oil sands production generates highly saline wastewater (often 5-10 barrels per barrel of oil produced) requiring disposal in regulated injection wells. Oil sands operations emit significantly more CO2 per barrel than conventional extraction, creating climate concerns regardless of where coal or other fuels are used in processing.
There have been several major environmental disasters related to oil in the U.S. For example, the Exxon Valdez oil spill in 1989 released 11 million gallons of oil into Prince William Sound, causing significant harm to marine life and ecosystems, and is considered one of the largest environmental disasters in U.S. history. Another example is the Deepwater Horizon oil spill in 2010, which resulted in the release of approximately 4 million barrels of oil into the Gulf of Mexico, leading to extensive environmental damage and loss of marine life. In response to such incidents, the Oil Pollution Act of 1990 was enacted to improve the nation’s ability to prevent and respond to oil spills, requiring facilities to develop spill response plans and providing funding for cleanups through a tax on oil.
Similar environmental concerns exist in some foreign supplier regions, meaning how much oil comes from any source involves tradeoffs for communities bearing extraction burdens.

Policy, climate goals, and the future of U.S. oil sourcing
U.S. climate policy, energy security goals, and technology shifts like electric vehicles will shape where the nation gets its oil in coming decades.
- Federal and state regulations, including recent EPA methane rules and Inflation Reduction Act incentives, pressure producers to reduce methane emissions, flaring, and spills both domestically and from foreign suppliers, and investors increasingly track regulatory changes in the oil and gas industry and what they mean for projects alongside frequently asked questions about domestic oil and gas investment structures and tax rules.
- As U.S. demand for gasoline and diesel potentially plateaus EIA projections suggest gasoline consumption may level around 8.5 million barrels per day by 2030 the mix of imports and exports may shift, with more oil production going to export markets.
- Diversification into electricity from renewable sources and stricter environmental standards may gradually lower total U.S. petroleum demand, reducing absolute volumes sourced from all regions, which has direct implications for what energy policies mean for oil and gas investments and for leveraging the best tax benefits available in oil and gas projects.
- The Trump administration and subsequent policy directions continue influencing infrastructure approvals and trade relationships with major suppliers.
- Any forward-looking discussion should emphasize uncertainty across multiple scenarios rather than precise forecasts industry analyses highlight surprising facts about the future of the oil and gas industry, examine how climate policy is reshaping oil and gas working-interest investments, and report when oil executives warn of broader industry slowdowns; at the same time, companies led by experienced executive teams such as Domestic Drilling & Operating’s leadership invite qualified investors to sign up for domestic energy investment opportunities or contact firms directly to explore specific drilling projects and partnerships, but the central fact remains: today, the United States gets most of its oil from domestic fields and from Canada, a pattern likely to persist even as the world’s energy mix evolves.
Frequently Asked Questions (FAQs)
Why does the U.S. still import oil if it is the world’s largest producer?
The U.S. imports oil primarily because its refineries are configured to process specific types of crude, especially heavy crude from Canada and Mexico, which domestic production does not fully supply. Regional logistics and economic factors also make imports more efficient for certain markets.
Which country supplies the most oil to the United States?
Canada is the largest foreign supplier, providing about 60% of U.S. crude oil imports through extensive pipeline networks from Alberta and Western Canada.
What is the difference between crude oil and total petroleum imports?
Crude oil is the raw, unrefined liquid extracted from the ground, while total petroleum imports include crude oil plus refined products like gasoline, diesel, and jet fuel, as well as natural gas liquids.
How can the U.S. be a net exporter of petroleum but still import oil?
The U.S. exports more total petroleum products (including refined fuels and natural gas liquids) than it imports, making it a net exporter overall, even though it continues to import crude oil to meet refinery needs.
What environmental impacts are associated with U.S. oil production?
Oil production generates greenhouse gas emissions, involves flaring of associated natural gas, and produces wastewater requiring disposal. Oil spills and pollution can harm ecosystems and communities, especially Indigenous and minority populations near extraction sites.
How has U.S. oil import sourcing changed over time?
Since the 1970s, the U.S. has shifted from heavy reliance on OPEC and Persian Gulf countries toward greater imports from North America, especially Canada, reflecting changes in production, refinery needs, and geopolitical factors.
What role do U.S. refineries play in the global oil market?
U.S. refineries process both domestic and imported crude oil into refined products. Many refined products are then exported to global markets, making the U.S. a major refining and export hub despite ongoing import.